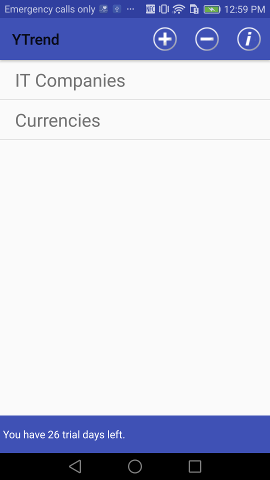
User can add new group there by pressing + button or delete group by pressing - button (new form will be appear) Or user can enter into existing group by pressing one of Groups buttons.
i icon provides access to that manual.
Inside group user gets acces to symbols (i.e. indicies, currency pairs, other financial instruments):
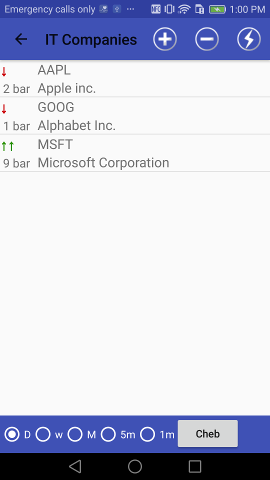
He can add new symbols (+ button) by search in Yahoo finance listed symbols. Yahoo driven suggest system (Google driven for Google Edition users) allows to search not only by symbol's name but by it's description substring also.
-
 - By pressing bolt button user starts data retrieving & recent signals' counting against the current group. After process completion up green or down red arrows should appear left to symbols dending on signal's direction and cell note says on what bar event occurs.
Supersignal users: if last signal is supersignal arrow is replaced by double arrow.
Data feed's & trend's settings are available from the next, Charts, screen.
Pressing on some symbol in Symbols panel leads to Charts panel:
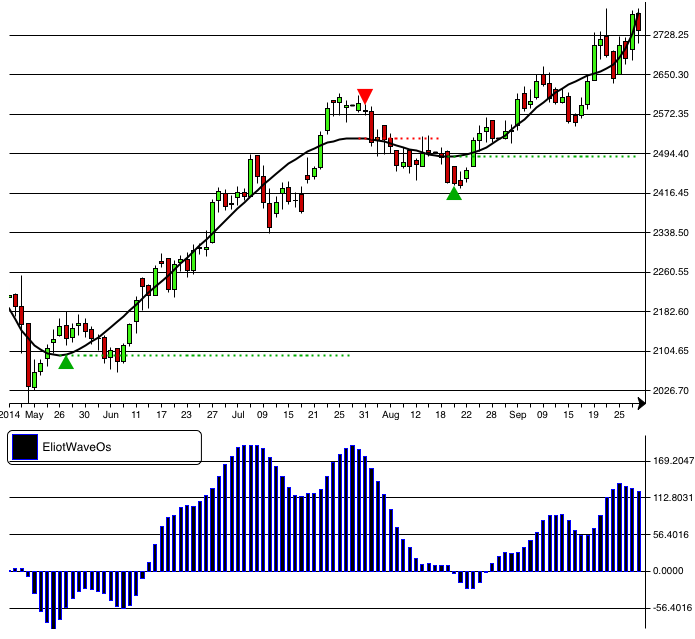
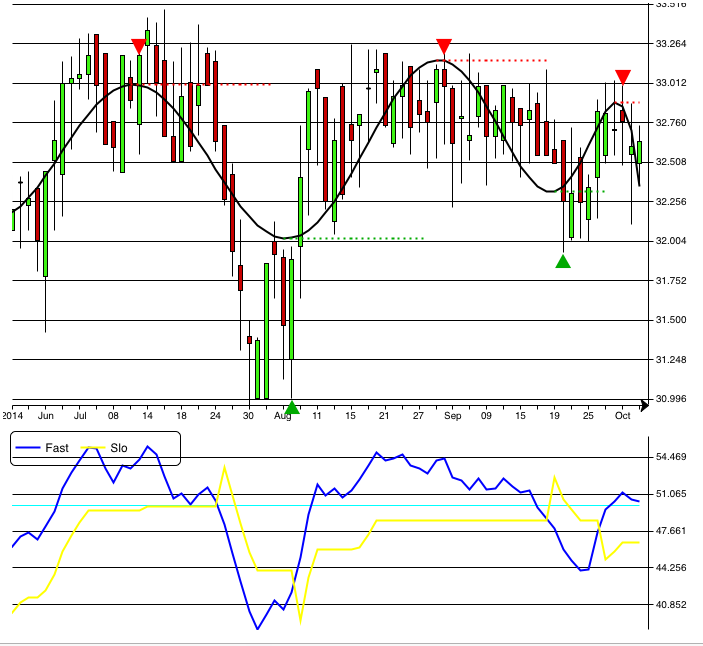
Red and green triangles show signal direction.
Pinch gesture allows to change the chart scale.
Top panel:
It's suitable for backtesting or some period of interest exploration.
-
 - shows dialog to add/edit symbol's comment;
-
 - turns to line draw mode:
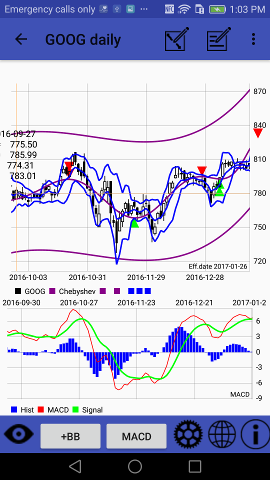
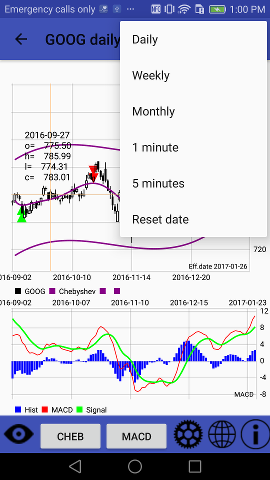
- Time frames could be changed via menu:
 Line draw mode
User can draw lines by fingers in that mode.
Press line draw mode button again to save your line & leave draw mode.
Button under chart allows to add to chart one of classic indicators: MA - upto 6 various MA lines; BB - Bollinger bands; SAR; FBB - Fibonacci Bollinger Bands; Price Channel.
And another button allows to select one of oscillators like MACD, Volume+Chaikin, BB%B, Slow and Fast Stochastic, RSI, CCI, ADX and more
Check Appendix #2 for the full current indicators'/oscillatrs' list.
There are some other buttons on the bottom toolbar:
-
 - after user set cursor on some date and press eye button, selected date becomes new effective (i.e. last)
-
 - Market Scanner web app link;
-
 - indicators settings. By pressing it user will enter into the Settings screen. It allows to tune indicators' settings
Chebyshev Trend indicator parameters description:
Chebyshev trend line is polynom of some order (2 for stright line and more), it's created using a modified Gaussian least squares fit on certain amount of data (60-200 in the app). The higher polynom order lead to more accurate polynom line. Lower polynom order lead to more common trend line, 2 for simple line trend for ex. Amount of data = time frames count taken in account in calculation. The longer it, the more past datas used for polynom calculation.
Some trading ideas
As I said earlier Chebyshev trend line is polynom of some order, it's created using a modified Gaussian least squares fit on certain amount of data. It's counted & redrawn when new data is available to fit best. So trend line data can be changed in the past & signals are re-counted too.
I think, it's not fully correct to generate signals based on the trend line, it's mostly for trend visualisation. But many people asked me about signals & I made it.
I think, there are 2 methods of trade could be: