FourierPredictor v.1.x.x Manual (iPad)
After the app has been started, it enters into Groups selection screen:
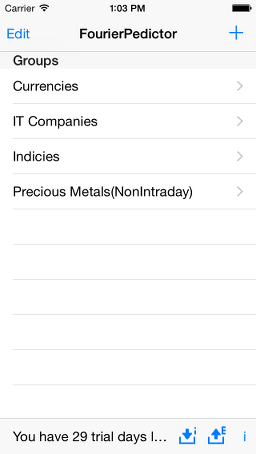
User can add new group there by pressing  button or edit group by pressing Edit button (Delete only command is available to the moment) or enter into existing group by pressing one of Groups buttons.
Bottom toolbar:
-  - exports groups' content to .csv files, one file per group to apps' shared Documents directory. Files are accessible via iTunes. File format is described in Appendix #1
-  - imports groups' content from all .csv files in apps' shared Documents directory. Directory is accessible via iTunes. File format is described in Appendix #1
- i icon allows access to that manual.
Inside group user gets acces to symbols (i.e. indicies, currency pairs, other financial instruments):
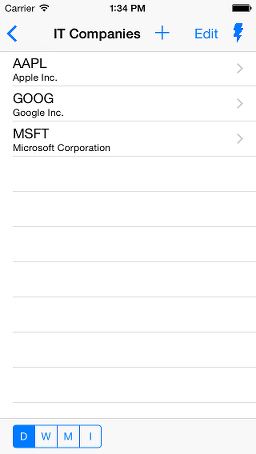
He can add new symbols ( button) by search in Yahoo finance listed symbols. Yahoo driven suggest system allows to search not only by symbol's name but by it's description substring also.
Pressing to  button leads to scan group and provide most close movement prediction:
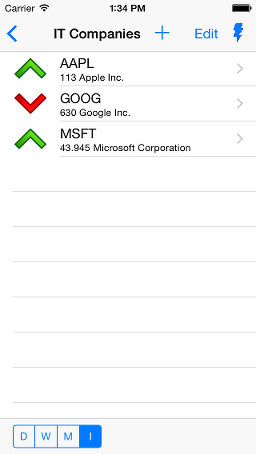
Bottom toolbar contains D/W/M/I selector. It allows to select Daily/Weekly/Monthly/Intraday datafeeds.
Intraday datafeeds quantity can be changed in Settings screen as described futher.
Chart's settings are available from the next, Charts, screen.
^M
Data feed's & chart's settings are available from the next, Charts, screen.
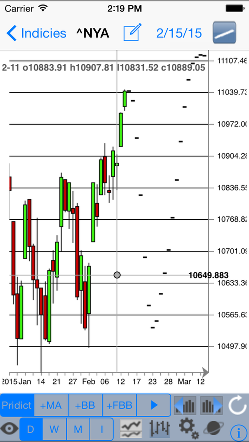
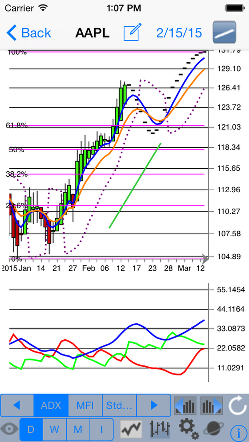
Pressing on some symbol in Symbols panel leads to Charts panel:
Double tap on Charts screen switchs view to compressed chart allowing to see more data!
Top panel:
Date on the top panel button shows the last user selected date.
That button pressing leads to calendar where user can select some old date. It's suitable for backtesting or some period of interest exploration.
When some old date is selected,  player button is shown on the left down side of the chart. It's backtest player. When the button is pressed, the next date chart is drawn. That is suitable for dynamic chart exploration.
-  - shows dialog to add/edit symbol's comment;
-  - turns to line draw mode:
User can draw lines by fingers in that mode. Two new buttons should appear in the right bottom corner of the device under the bottom toolbar:
-  - erase lines mode toggle;
-  - lines color button;
Press line draw mode button again to save your line & leave draw mode.
Radio group under chart allows to add to chart one of classic indicators: MA - upto 6 various MA lines; BB - Bollinger bands; SAR; FBB - Fibonacci Bollinger Bands. In these versions it's available for free.); Price Channel.
Check Appendix #2 for the full current indicators'/oscillatrs' list.
There are some new buttons on the bottom toolbar:
- Daily/Weekly/Monthly/Intraday (Intraday quantity is available via the first Settings menu) time frames selection. Attention to Google Edition users: as soon as it fully oriented on intraday bars the selector looks like  Abbreviations mean 1, 5, 15, 30 minutes
-  - to turn charts to candles view from ohlc view and it's changed to
  if so.
-  - allows to turn charts from indicators selection mode to oscillators selection mode.
In that mode indicators radiogroup is changed to oscillators radiogroup and 2-charts bottom panel button is changed to 1-chart mode selection button.
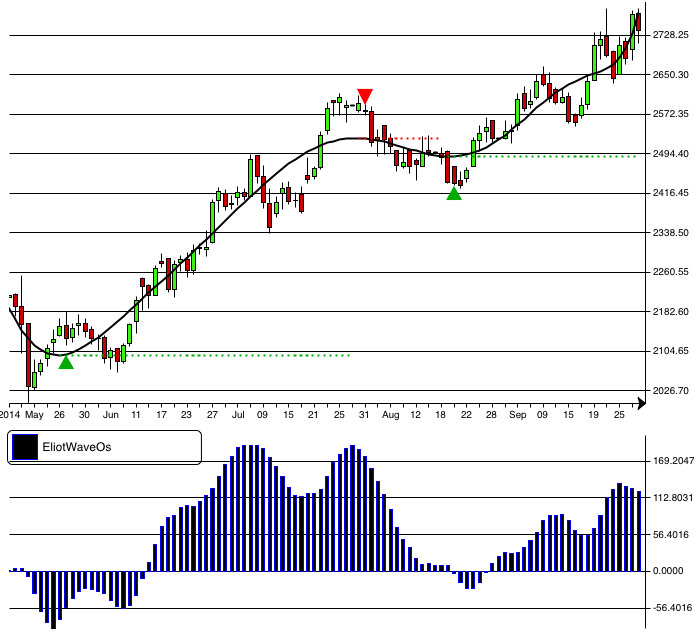
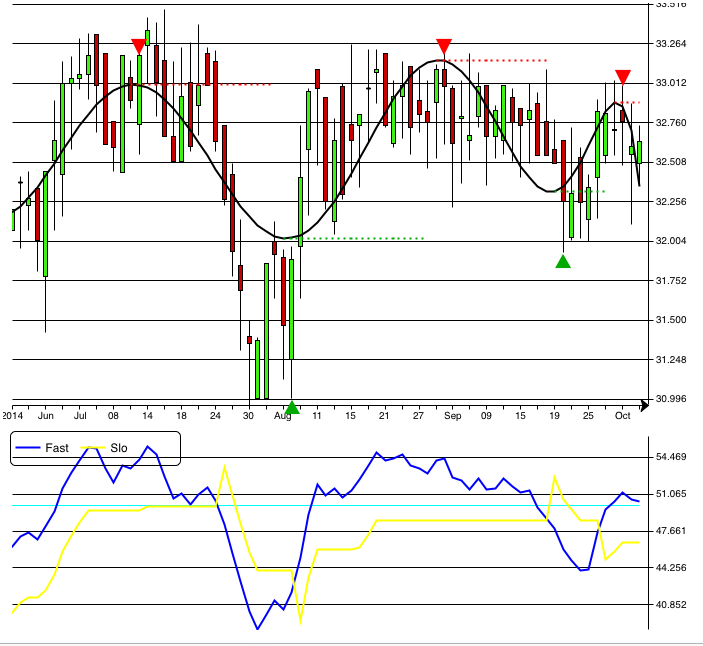
Curretly available oscillators are: MACD, Volume+Chaikin, BB%B, Slow Stochastic, RSI, CCI, ADX, MFI, Standard Deviation, Fast Stochastic, EliotW, QQE.
-  - Refresh button allows to refresh data and redraw charts.
-  - Market Scanner web app link (beta version);
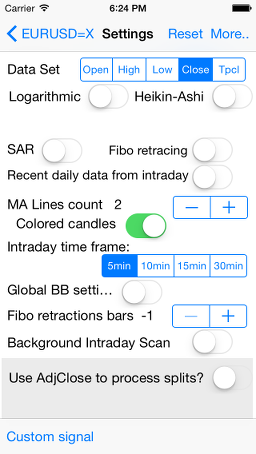
-  - indicators settings. By pressing it user will enter into Settings screen. It allows to tune MA, Bollinger Bands, Parabolic SAR, MACD, etc. indicators & oscillators:
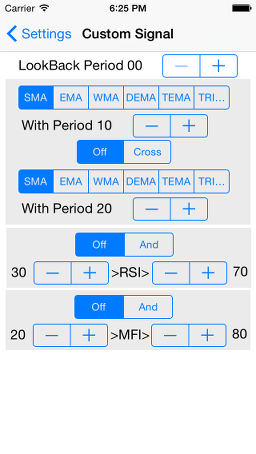
New Custom signal feature is currently provided as beta.
It's idea to provide some sort of custom signal, user can design visually from some classical components. To the moment it's 2 MA cross & RSI & MFI levels possibly.
When user sets up the custom signal, no additional lines will be shown on the chart, only blue signal triangles if signal occurs.
This allows to add any lines to the chart separatelly.
MA settings for the cross are separated but RSI & MFI settings are taken from the app's "Settings" screen.
About BB%B oscillator:
Thanks TayJT who offered to implement it. He provided the formula as it was developed by Tradestation members:
BB%B = 100 * ( Price - LowerBand ) / ( UpperBand - LowerBand ) ;
Ken Burkhalter modified it to scale chart from 100/0/-100:
BB%B = 100 * ((Price-LowBand) - (HighBand - LowBand)/2) / ((HighBand-LowBand)/2);
This would more clearly show the deviation of a price from mean value.
More info about Fibonacci Bollinger Bands there:
Fibonacci Bollinger Bands
Good luck!
More apps
Appendix1: Import/Export file format.
The Import/Export file is regular text csv file without header. File name = Group name.
Fields are delimited with '~' character.
Fields list:
- Symbol's abbreviation in Yahoo Finance format. Examples: AAPL, ^NYA. The only mandatory field!
- Symbol's name. If absent, assumed equal to abbreviation.
- Exchange's abbreviation in Yahoo Finance format. Example: ASE for American Stock Exchange.
- Amount of data for Kalman Curve. Default 100.
- Smooth Factor. Default 20.
- Supersignal polynom order. Default 4.
- Supersignal standard deviation. Default 2.
- Bollinger Bands MA type. Default EMA
- Bollinger Bands period. Default 5
- Bollinger Bands standard deviation. Default 2
- Symbol's comment, if any.
If you plan to provide only the first one, two or three fields, complete string with ~ character.
Appendix2: Full indicators' list.
Top panel indicators:
- up to 6 MA (SMA, EMA, WMA, DEMA, TEMA, TRIMA). MA's amount, type & period are defined in the Settings.
- BB - Bollinger Bands
- FBB - Fibonacci Bollinger Bands
- PrceCh - Price Channel
- XEliot - Elliott X-waves
Bottom panel indicators/oscillators:
- MACD
- Chaikin - Volume + ADOSC
- BB%B line
- BB%B histogram
- Slow Stochastic
- RSI
- CCI
- ADX
- MFI
- StdDev
- Fast Stochastic
- EliotW - Elliot Waves/li>
- QQE
- Williams %R
From the Settings the next indicators are available:
More apps

 button or edit group by pressing Edit button (Delete only command is available to the moment) or enter into existing group by pressing one of Groups buttons.
 - exports groups' content to .csv files, one file per group to apps' shared Documents directory. Files are accessible via iTunes. File format is described in Appendix #1
 - imports groups' content from all .csv files in apps' shared Documents directory. Directory is accessible via iTunes. File format is described in Appendix #1
 button) by search in Yahoo finance listed symbols. Yahoo driven suggest system allows to search not only by symbol's name but by it's description substring also.
 button leads to scan group and provide most close movement prediction:


 player button is shown on the left down side of the chart. It's backtest player. When the button is pressed, the next date chart is drawn. That is suitable for dynamic chart exploration.
 - shows dialog to add/edit symbol's comment;
 - turns to line draw mode:
 - erase lines mode toggle;
 - lines color button;
 Abbreviations mean 1, 5, 15, 30 minutes
  - to turn charts to candles view from ohlc view and it's changed to
  if so.
 - allows to turn charts from indicators selection mode to oscillators selection mode.
 - Refresh button allows to refresh data and redraw charts.
 - Market Scanner web app link (beta version);
 - indicators settings. By pressing it user will enter into Settings screen. It allows to tune MA, Bollinger Bands, Parabolic SAR, MACD, etc. indicators & oscillators: