ChebyshevTrendPro v.2.x.x Manual (iPhone)
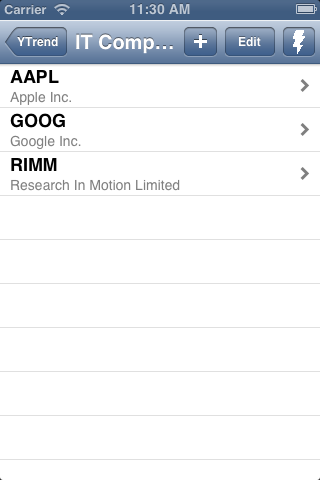
After the app has been started, it enters into Groups selection screen:
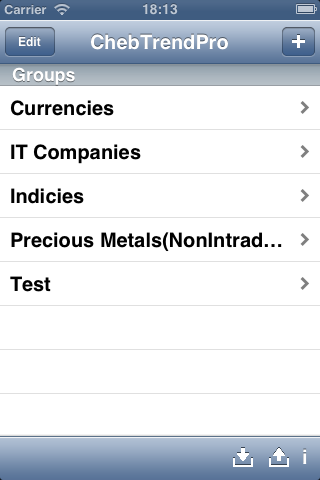
User can add new group there by pressing  button or edit group by pressing Edit button (Delete only command is available to the moment) or enter into existing group by pressing one of Groups buttons.
Bottom toolbar:
-  - exports groups' content to .csv files, one file per group to apps' shared Documents directory. Files are accessible via iTunes. File format is described in Appendix #1
-  - imports groups' content from all .csv files in apps' shared Documents directory. Directory is accessible via iTunes. File format is described in Appendix #1
- i icon allows access to that manual.
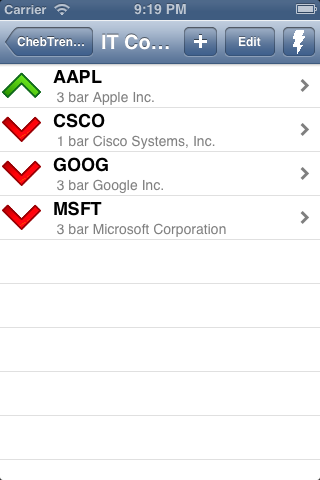
Inside group user gets acces to symbols (i.e. indicies, currency pairs, other financial instruments):
He can add new symbols ( button) by search in Yahoo finance listed symbols. Yahoo driven suggest system (Google driven for Google Edition users) allows to search not only by symbol's name but by it's description substring also.
Long press on any symbol marks it with + character and move it to the top of the symbols' list. Suitable for mark of symbol of interest. Another long press turns off the mark;
-  - By pressing zip button user starts data retrieving & recent signals' counting against the current group. After process completion up green or down red arrows should appear left to symbols dending on signal's direction and cell note says on what bar event occurs:
Supersignal users: if last signal is supersignal arrow is replaced by double arrow.
Data feed's & trend's settings are available from the next, Charts, screen.
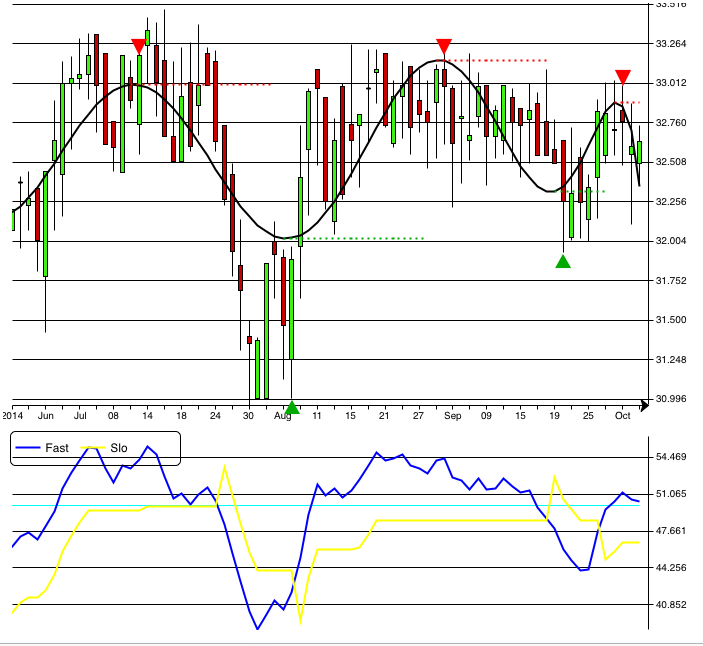
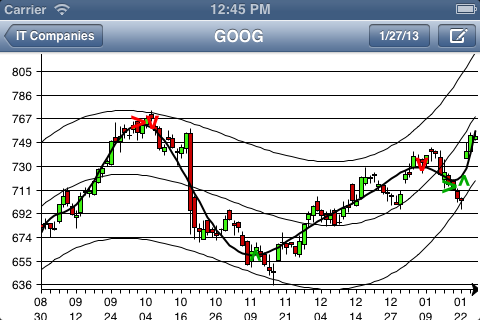
Pressing on some symbol in Symbols panel leads to Charts panel:
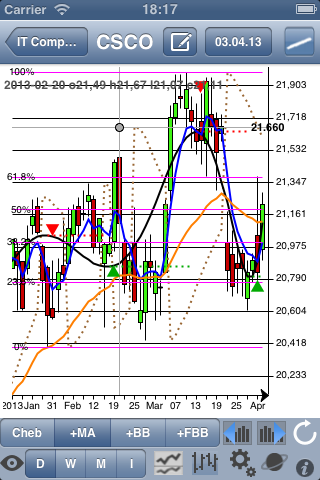
Red and green triangles show signal direction. As soon as signals can disappear or change their direction depending of indicator's dynamic nature, user can fix signal of interest by long press on it. In this case signal will be saved. Fixed signal is appeared as white arrow in blue button.
Double tap on Charts screen switchs view to compressed chart allowing to see more data! (N/A on Google ed. to the moment)
Top panel:
Date on the top panel button shows the last user selected date.
That button pressing leads to calendar where user can select some old date. It's suitable for backtesting or some period of interest exploration.
When some old date is selected,  player button is shown on the left down side of the chart. It's backtest player (available as in-app purchase). When the button is pressed, the next date chart is drawn. That is suitable for dynamic chart exploration.
-  - shows dialog to add/edit symbol's comment;
-  - turns to line draw mode:
Line draw mode
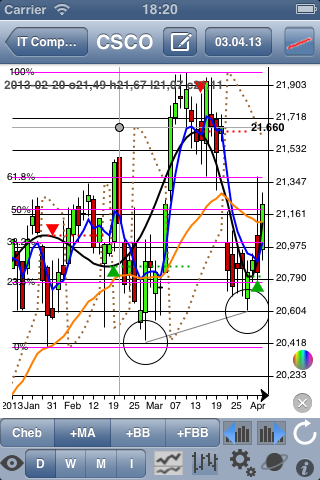
User can draw lines by fingers in that mode. Two new buttons should appear in the right bottom corner of the device under the bottom toolbar:
-  - erase lines mode toggle;
-  - lines color button;
Press line draw mode button again to save your line & leave draw mode.
Radio group under chart allows to add to chart one of classic indicators: MA - upto 6 various MA lines; BB - Bollinger bands; SAR; FBB - Fibonacci Bollinger Bands (available as In-App purchase in all versions except Lite & FOREX ed. versions. In these versions it's available for free.); Price Channel.
Check Appendix #2 for the full current indicators'/oscillatrs' list.
There are some new buttons on the bottom toolbar:
- Daily/Weekly/Monthly/Intraday (Intraday quantity is available via the first Settings menu) time frames selection. Attention to Google Edition users: as soon as it fully oriented on intraday bars the selector looks like 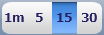 Abbreviations mean 1, 5, 15, 30 minutes
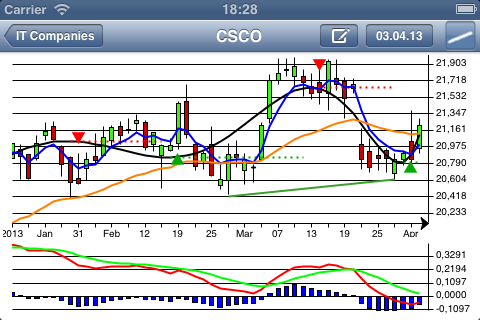
-  - to turn charts to candles view from ohlc view and it's changed to
  if so.
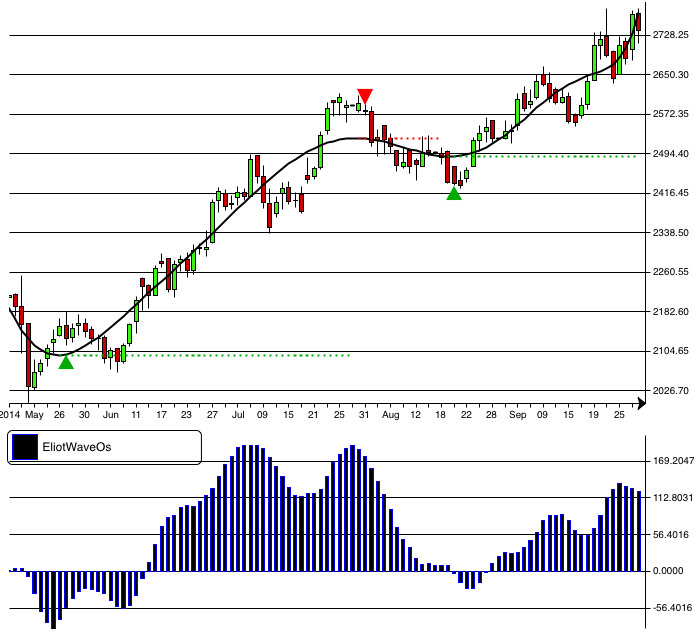
-  - allows to turn charts into 2-charts mode:
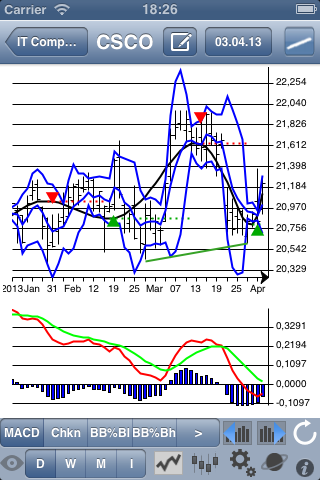
In that mode indicators radiogroup is changed to oscillators radiogroup and 2-charts bottom panel button is changed to 1-chart mode selection button.
Curretly available oscillators are: MACD, Volume+Chaikin, BB%B, Slow Stochastic, RSI, CCI, ADX
-  and
and  - buttons allow to switch between charts quickly
-  - Refresh button allows to refresh data and redraw charts.
-  - Market Scanner web app link (beta version);
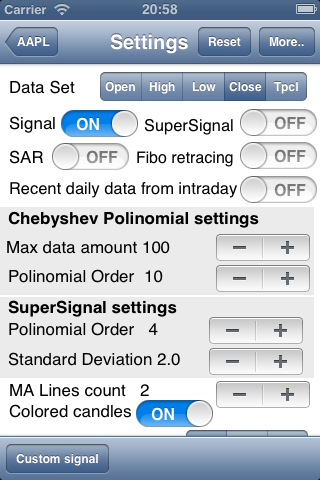
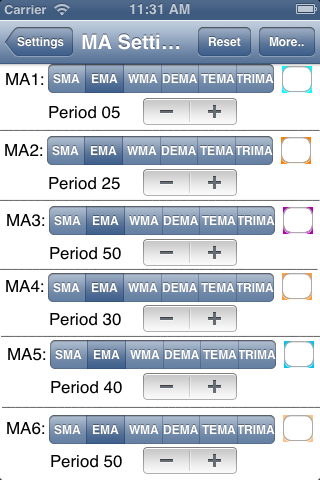
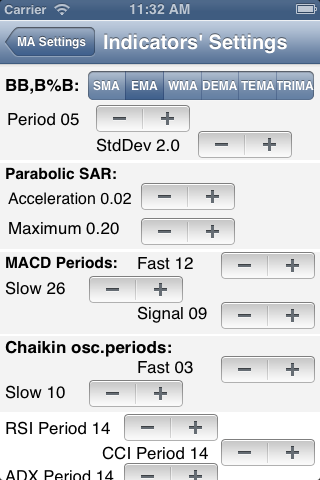
-  - indicators settings. By pressing it user will enter into first Settings screen. It allows to tune common app settings & both ChebyshevTrend & supersignal (if purchased) settings. By pressing "More" button user can enter into the second and the third "Settings" screens. It allows to tune settings for Chebyshev Trend, MA, Bollinger Bands, Parabolic SAR, MACD, Chaikin ndicators & oscillators:
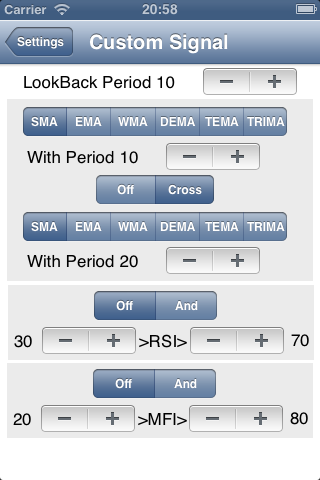
New Custom signal feature is currently provided as beta.
It's idea to provide some sort of custom signal, user can design visually from some classical components. To the moment it's 2 MA cross & RSI & MFI levels possibly.
When user sets up the custom signal, no additional lines will be shown on the chart, only blue signal triangles if signal occurs.
This allows to add any lines to the chart separatelly.
MA settings for the cross are separated but RSI & MFI settings are taken from the app's appropriate "Settings" screen.
In landscape iPhone mode bottom toolbar are hidden to provide more screen space for charts.
Chebyshev Trend indicator parameters description:
Chebyshev trend line is polynom of some order (2 for stright line and more), it's created using a modified Gaussian least squares fit on
certain amount of data (60-200 in the app). The higher polynom order lead to more accurate polynom line.
Lower polynom order lead to more common trend line, 2 for simple line trend for ex.
Amount of data = time frames count taken in account in calculation. The longer it, the more past datas used for polynom calculation.
New Intraday Background Scanner feature was developed for v.2.0.7.
When the appropriate setting is turned on, signals search via all symbols in app is made and their list is formed in the app memory.
User should turn app into the background now. After intraday time frame period is over, local notification is delivered to user.
Now he can start app by pressing on local notification banner. Signals search via all the symbols is made again and compared against previous signals.
If signals' directions are changed, the message is shown.
Some trading ideas
As I said earlier Chebyshev trend line is polynom of some order, it's created using a modified Gaussian least squares fit on certain amount
of data. It's counted & redrawn when new data is available to fit best. So trend line data can be changed in the past &
signals are re-counted too.
I think, it's not fully correct to generate signals based on the trend line, it's mostly for trend visualisation. But many people asked me
about signals & I made it.
I think, there are 2 methods of trade could be:
- Signal was in the past & trend line shows almost constant direction. You can open trade & set stop near opposite s/r line.
- Signal is now. You can try to open trade & set initial stop-loss as close as possible to signal and ajust it if trend really moves
according to signal.
SuperSignal is developed at last!
A lot of us searched how to improve the app signals quality but most succesfull inventor is Alon Hadar!
And there is a method description as he explains it:
the key is to use only the signals that are paralleled to price touching lower order channels
in the direction of the channels trend only
long = channels are up + price near channel's bottom + chebyshev signal buy
short = channels are heading down + price near channel's upper line + chebychev signal sell
Put attantion that there are 2 variables for the channel that can change ther results - the most important is the polynom order - default is 4
but in some cases the 3/5/6 show better results. The trader should "play" with the channel order to find the channel
that is most reliable meaning that price touch the bands and reverse as much as possible.
The second variable is the standard deviation which default is 2 like bollinger
but in some cases when the security is very volatile you can increase the s.d. to get better results.
The last tip is:
Traders should trade only the signals that are in the direction of the last signal in the higher frame meaning -
if in weekly frame last signal is long they should take all long signals on daily frame and avoid all short signals;
if in weekly frame last signal is short they should take all short signals on daily frame and avoid all long signals.
Also Marcello Djunaidy offers to use Supersignal as an envelope for overbought/oversold indication: buy when below envelope, sell when above envelope
About BB%B oscillator:
Thanks TayJT who offered to implement it. He provided the formula as it was developed by Tradestation members:
BB%B = 100 * ( Price - LowerBand ) / ( UpperBand - LowerBand ) ;
Ken Burkhalter modified it to scale chart from 100/0/-100:
BB%B = 100 * ((Price-LowBand) - (HighBand - LowBand)/2) / ((HighBand-LowBand)/2);
This would more clearly show the deviation of a price from mean value.
More info about Fibonacci Bollinger Bands there:
Fibonacci Bollinger Bands
Good luck!
Candlesticks patterns
Currently availabe:
- Three Line Strike (3LS)
- Evening Star (ES)
- Abandoned Baby (AB)
More info...
More apps
Appendix1: Import/Export file format.
The Import/Export file is regular text csv file without header. File name = Group name.
Fields are delimited with '~' character.
Fields list:
- Symbol's abbreviation in Yahoo Finance format. Examples: AAPL, ^NYA. The only mandatory field!
- Symbol's name. If absent, assumed equal to abbreviation.
- Exchange's abbreviation in Yahoo Finance format. Example: ASE for American Stock Exchange.
- Amount of data for Chebyshev polynom calculation. Default 100.
- Chebyshev polynom order. Default 10.
- Supersignal polynom order. Default .
- Supersignal standard deviation. Default 2.
- Bollinger Bands MA type. Default
- Bollinger Bands period. Default
- Bollinger Bands standard deviation. Default
- Symbol's comment, if any.
If you plan to provide only the first one, two or three fields, complete string with ~ character.
Appendix2: Full indicators' list.
Top panel indicators:
- up to 6 MA (SMA, EMA, WMA, DEMA, TEMA, TRIMA). MA's amount, type & period are defined in the Settings.
- BB - Bollinger Bands
- FBB - Fibonacci Bollinger Bands (available for free in ChebyshevTrendLite & FOREX ed.; available as tier 1 in-app purcase in other versions)
- PrceCh - Price Channel
- XEliot - Elliott X-waves
- Ichimoku
Bottom panel indicators/oscillators:
- MACD
- Chaikin - Volume + ADOSC
- BB%B line
- BB%B histogram
- Slow Stochastic
- RSI
- CCI
- ADX
- MFI
- StdDev
- Fast Stochastic
- EliotW - Elliot Waves/li>
- QQE
- Williams %R
From the Settings the next indicators are available:
More apps